Methods & provenance
This atlas was built de novo: rather than starting from an existing biomarker list, every molecule was surfaced by an independent, ground-up harvest of primary evidence and then placed within the Type 1 (atherothrombotic) myocardial-infarction cascade.
How the catalog was built
- Literature harvest. Ten faceted PubMed queries spanning plaque rupture, ACS proteomics, MI genomics, platelet and coagulation markers, vascular inflammation, metabolomics, lipidomics, endothelial erosion and novel-biomarker discovery yielded 2,645 abstracts.
- Named-entity extraction. Every abstract was mined with a language model to extract specific molecules tied to the atherothrombotic context, with a mechanistic role hint. Mentions were normalized to canonical names/genes and merged.
- Omics. 175 MI-relevant datasets from GEO, PRIDE and ArrayExpress were retained after relevance filtering and linked to molecules by title.
- Clinical trials. 974 ClinicalTrials.gov studies of MI/ACS biomarkers and antithrombotic targets were scanned and linked.
- Human genetics. 177 Open Targets disease-associated genes and 209 GWAS-catalog MI genes were merged in; genetic-only genes were classified by function.
- Druggability. Open Targets tractability and known-drug counts were attached for 1,054 gene targets.
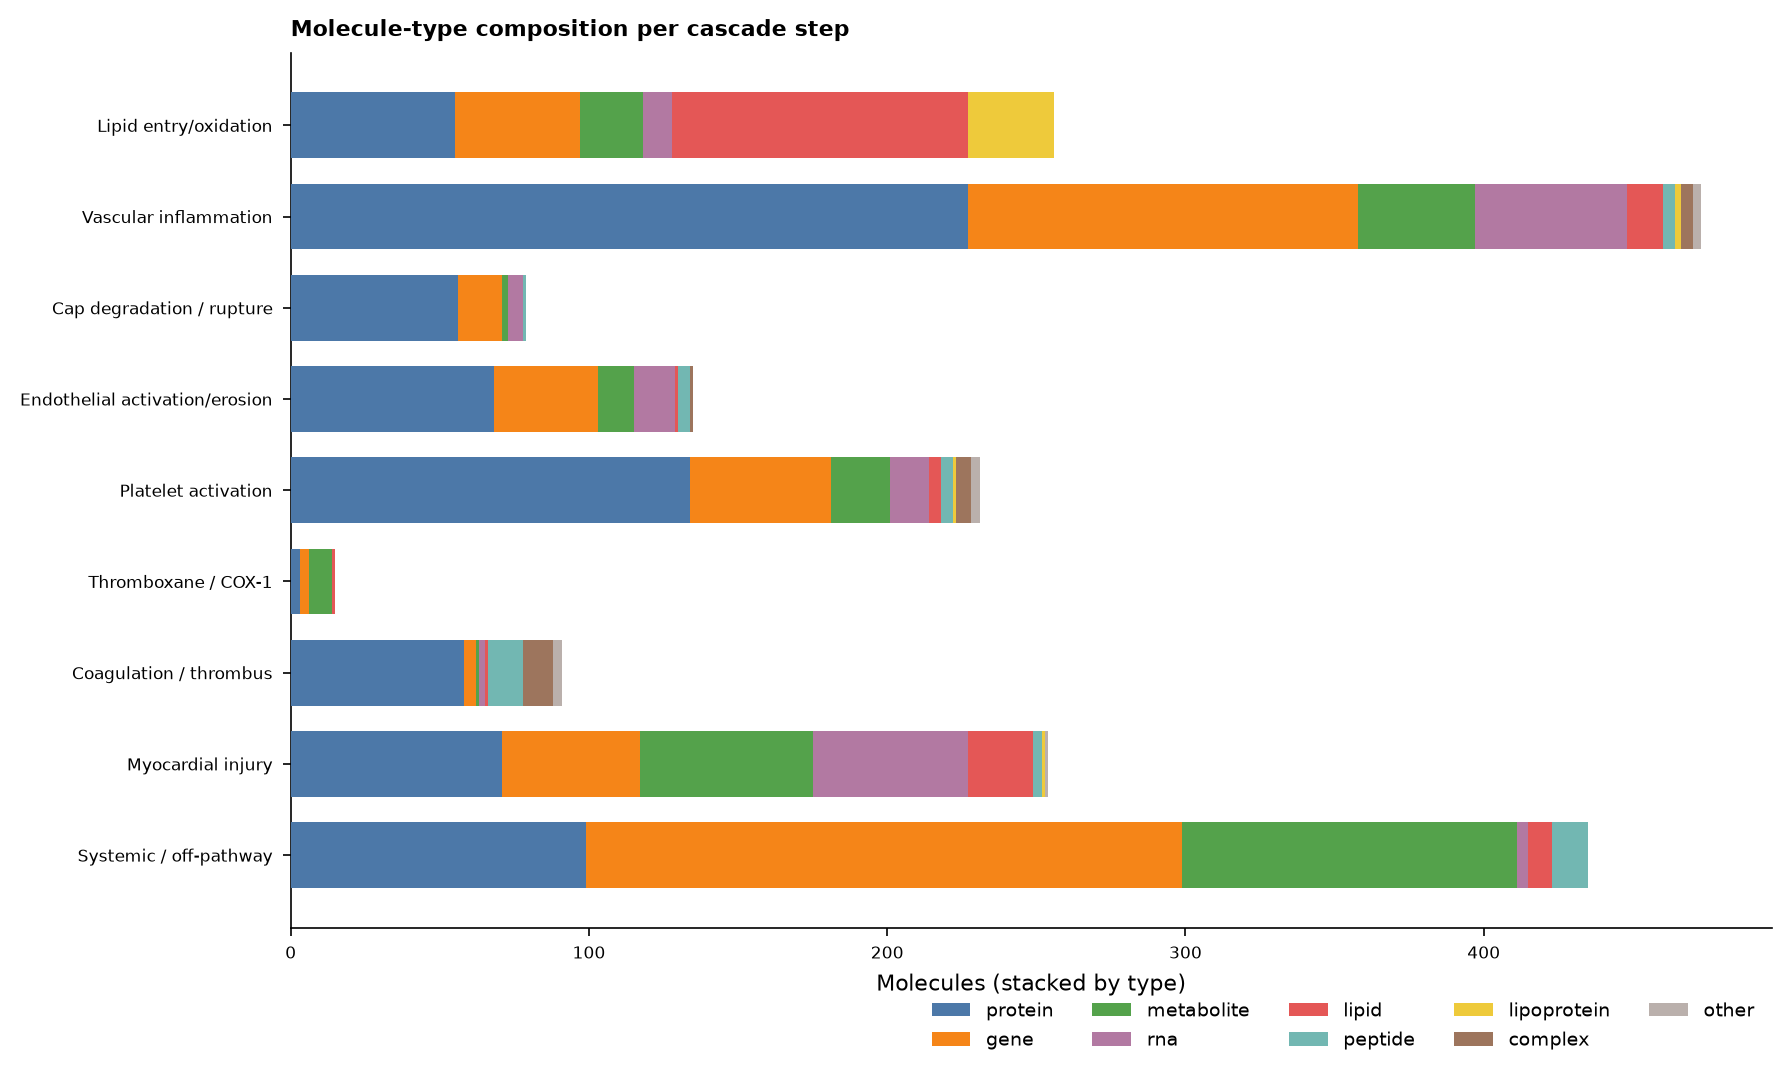
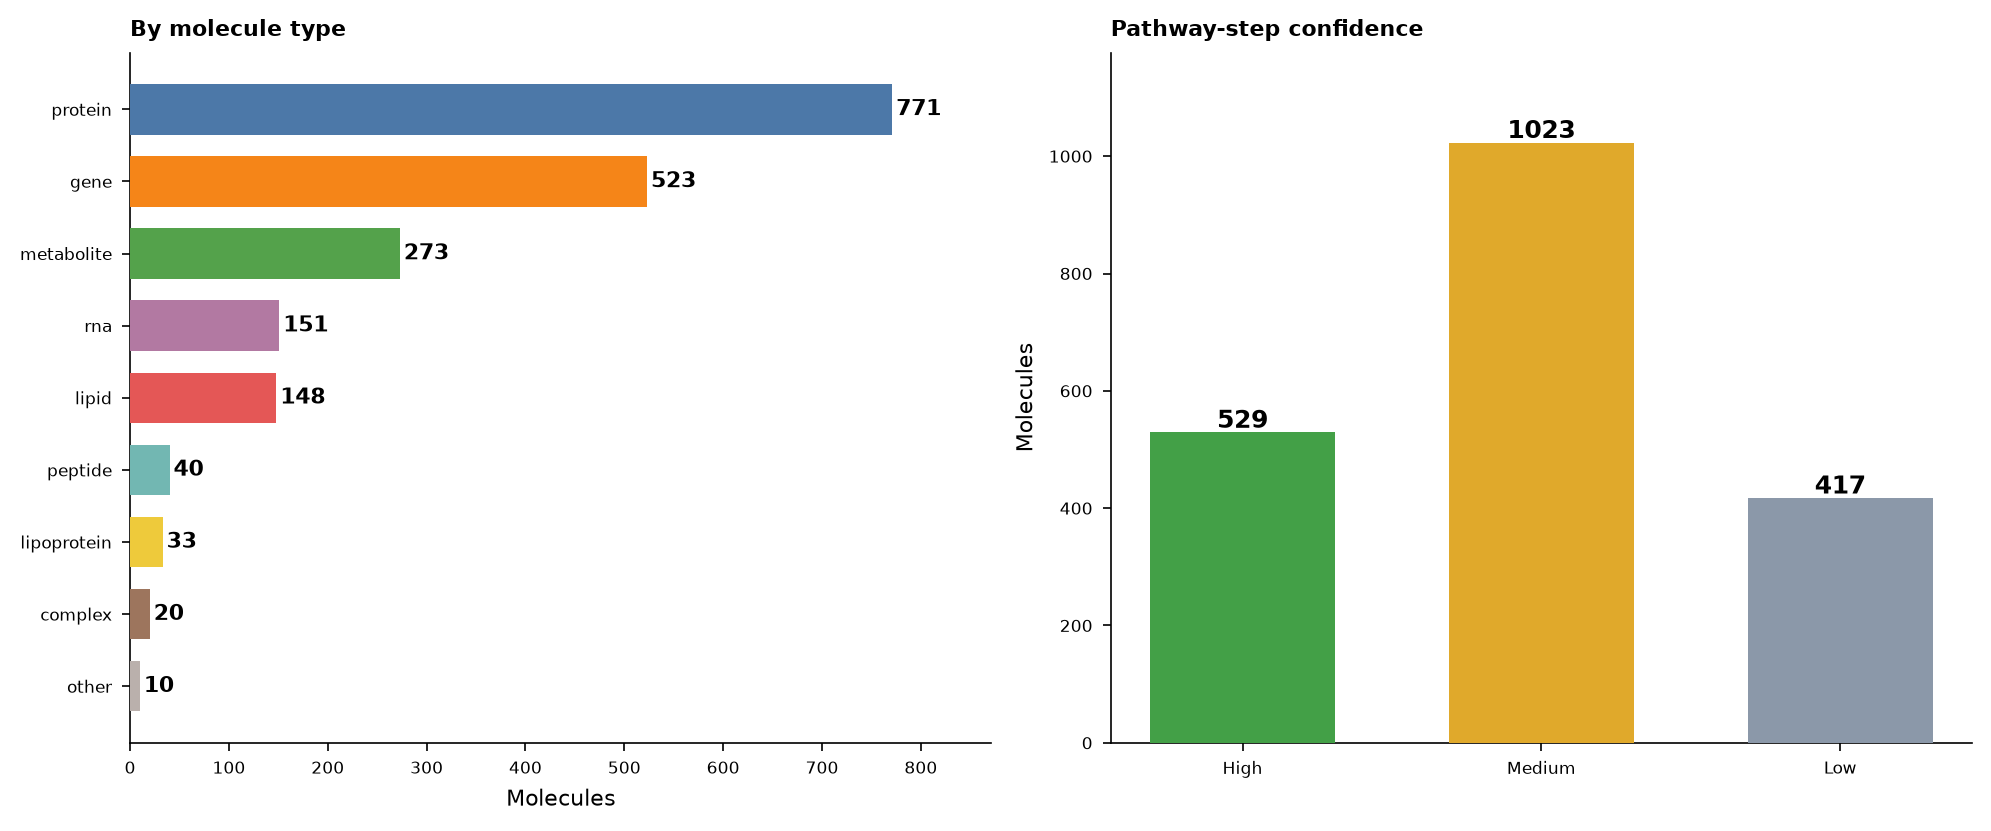
- Pathway placement. Each molecule was assigned a primary cascade step with a confidence and a one-line rationale, synthesized from its harvested roles.
- Consolidation. A curation pass merged entries that are the same analyte harvested at different granularity (free-text mentions vs. gene-anchored records, or gene-symbol aliases) into a single canonical entry, folding their evidence together. Genuinely distinct gene products — e.g. troponin I (TNNI3) vs. troponin T (TNNT2), or glycoprotein Ib subunits — were deliberately kept separate. This reduced the 1,969 raw harvested entries to 1,948 distinct molecules (21 duplicates merged).
Counts throughout the site reflect the deduplicated catalog (1,948 molecules). The raw harvest recovered 1,969 entries before consolidation. Under the broadened Type-I-vs-non-Type-I comparator, the markers with any direct head-to-head study resolve to 16 distinct analytes — up from six under the Type-2-only comparator — of which six are flagged weak. Two of the original six were revised on stronger evidence: copeptin reverses direction (a 2024 differentiation study with an external validation cohort of 1,390 finds it higher in Type 2, not Type 1), and cardiac myosin-binding protein C gains a quantitative differential. Apolipoprotein E is retained but flagged weak: the source reports that a comparison was performed without giving group-level values.
The comparator: Type I vs non-Type I MI
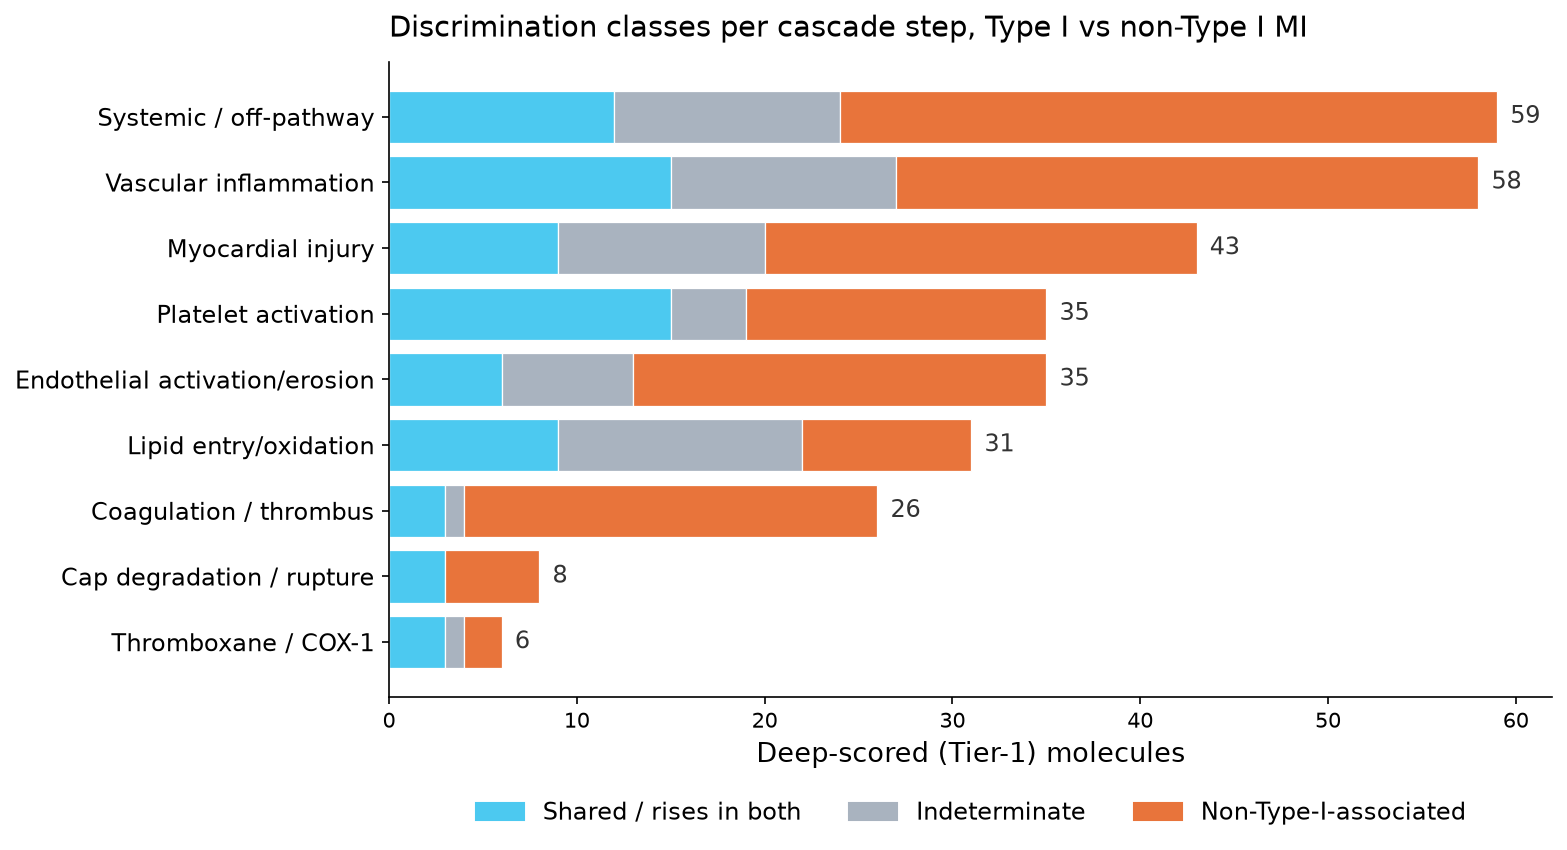
Discrimination is scored against the full Fourth Universal Definition (UDMI-4) non-Type-1 set, not Type 2 alone. A marker earns a high specificity score only if it tracks atherothrombosis and not the other ways myocardium infarcts: supply–demand mismatch (Type 2), sudden cardiac death (Type 3), PCI-related periprocedural injury (Type 4a), stent thrombosis (Type 4b), in-stent restenosis (Type 4c) and CABG-related injury (Type 5).
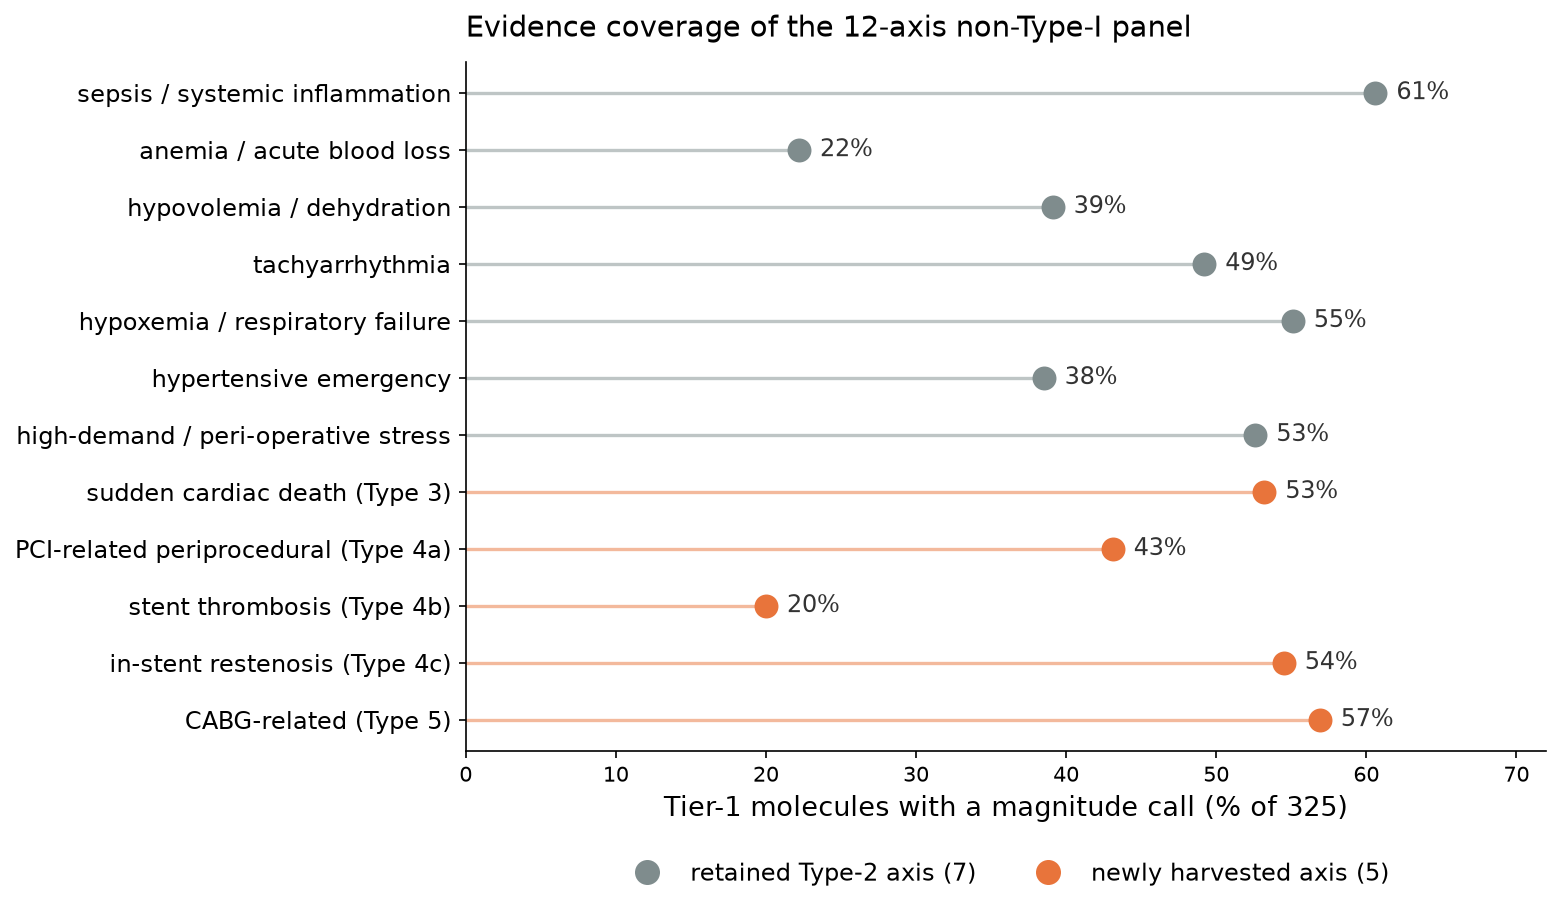
Each Tier-1 molecule carries a 12-axis panel — the seven demand/Type-2 axes plus one axis per additional subtype — harvested from PubMed with the supporting PMIDs attached to every call. Coverage is uneven, and the table below reports it as measured rather than as intended:
| Axis | UDMI | Scored / 325 | Evidence base |
|---|---|---|---|
| 7 demand axes (retained) | 2 | 72–197 per axis | anemia thinnest (72); sepsis best-covered (197) |
| sudden cardiac death | 3 | 173 (53.2%) | 127 human, 31 animal — many only via post-mortem biochemistry |
| PCI-related periprocedural | 4a | 140 (43.1%) | 123 human |
| stent thrombosis | 4b | 65 (20.0%) | 43 human, 14 mechanistic — thinnest new axis |
| in-stent restenosis | 4c | 177 (54.5%) | 84 human, 81 animal neointimal models |
| CABG-related | 5 | 185 (56.9%) | 156 human — best-covered new axis |
Three consequences of this design deserve to be stated rather than buried:
- Type 4b penalises atherothrombotic markers, and that is correct. Stent thrombosis shares Type I's mechanism, so a platelet or coagulation marker that rises in 4b is failing to separate Type I from a non-Type-I subtype. The penalty is captured faithfully rather than corrected away — which is why several platelet and coagulation markers score lower here than they did under the Type-2-only comparator.
- Sparse axes are a property of the literature, not a search failure. Type 3 MI is defined by death before biomarkers could be drawn, so ante-mortem data mostly does not exist; the post-mortem values that do exist are confounded by post-mortem redistribution, cellular lysis and post-mortem interval, and are not equivalent to ante-mortem measurements. Type 4c evidence leans heavily on animal neointimal models.
- Absence of evidence is never zero. An axis nobody has studied renders as — and is excluded from the specificity denominator. A magnitude of 0 — studied in that setting and did not move — is a real result that improves a marker's score, and is kept distinct from an unstudied axis.
One audit worth disclosing. All 765 scored findings on the new axes were re-read against their own supporting text. Twenty-eight carried a magnitude of 0 while the underlying abstract had only tested a baseline predictor — a pre-procedural level, a genotype, or a therapeutically administered agent — and never measured the analyte changing in that setting. A spurious zero is doubly harmful here: it enters the specificity denominator and pulls the mean down, inflating apparent Type-I specificity. Those 28 were reverted to “not assessed”. A further 183 findings with a magnitude of 1 or more read as predictor-only on the same test; they were left untouched, because re-adjudicating an asserted magnitude is re-harvesting rather than rescoring, and they are recorded in the data as a known upper bound on how much the specificity scores may still be inflated.
Direct head-to-head evidence remains the binding constraint. Only 16 of 325 Tier-1 molecules (4.9%) have any study directly comparing the marker between Type I and a non-Type-I group, and six of those are flagged weak. Every one of the 16 compares against Type 2 only: dedicated searches for head-to-head comparisons against Types 3, 4a, 4b, 4c and 5 returned no admissible level comparison at all. That null is one of the more useful findings on this page — the procedural and sudden-death subtypes are essentially unstudied as biomarker-discrimination problems.
Coverage vs. our own earlier (abandoned) 260-molecule attempt
Both projects were created for the Anthropic Life Science Hackathon, and both were started after the hackathon was launched. To avoid any confusion, the exact creation timestamps (from their git histories) are:
- Earlier, abandoned attempt (t1t2-biomarker-miner): first commit Tuesday, July 7, 2026 at 2:38 PM EDT (6:38 PM UTC); abandoned the same day (last commit 8:51 PM EDT).
- This project — CoronaryAtlas (t1-mi-pathway-atlas): first commit Thursday, July 9, 2026 at 9:42 PM EDT (Friday, July 10, 2026 at 1:42 AM UTC).
The 260-molecule catalog referenced here is therefore not prior work by others — it was our own first attempt, built roughly two days before this project during the same hackathon. That earlier build was abandoned because its approach was not leading to the right answer (the analysis had gone down the wrong path), so this project was started fresh with a clean de novo harvest. The comparison below is therefore an internal sanity check against our own discarded draft, not a reuse of external prior art. The code for that abandoned earlier project is archived at github.com/singamnv/t1t2-biomarker-miner.
As that cross-check, the de novo catalog (1,969 molecules) was compared to the abandoned 260-molecule draft. A robust name/gene match re-found 168/260 (64.6%) of the earlier entries, and added 1,801 molecules that draft did not contain — confirming the fresh build is a strict superset of what we had before, arrived at by a sounder method.
The 92 earlier-draft entries not matched are all miRNA / lncRNA isoforms that draft enumerated at finer granularity (e.g. miR-133a-3p, consolidated to miR-133 here) — the same molecules are present at family level. There are no non-miRNA absences: the one genuine protein miss (Gas6) has been harvested and added, and TMAO is present as Trimethylamine N-oxide. Matching uses gene symbol, normalized name, and full name-word containment, so entries like PAPP-A→PAPPA, PlGF→PGF, SORT1, PHACTR1, APOE and SAA1 are correctly counted as re-found.
Confidence & limitations
Pathway-step assignment is an evidence-tagged inference, not a curated ground truth; each molecule carries a confidence dot (green/amber/grey). Molecule extraction from free-text abstracts is imperfect and can miss or mis-name entities. Trial and omics links are title-level string matches and are conservative. Discrimination scores are mined from abstracts, so a cited study may be topically relevant to a marker without directly testing the comparison stated, and axis coverage varies widely across the non-Type-I subtypes (see the coverage table above). The atlas is a discovery-oriented map for hypothesis generation, not a clinical decision tool.
Future directions
CoronaryAtlas is a discovery-oriented map, not a finished clinical instrument. To make it accurate and responsible, our roadmap is:
- Companion ASCVD risk-biomarker atlas. A sibling atlas mapping biomarkers of atherosclerotic cardiovascular disease risk — the prediction-and-prevention side of the same biology — now in development at ascvd.coronaryatlas.com. Together the two atlases span the arc from long-term risk to the acute Type-1 MI event.
- Quote-grounded, full-text evidence. Move from abstract-level mining to PMC full text, attaching the verbatim supporting sentence to every scored claim so a reviewer can check each one directly.
- Adjudicated, multi-center validation. Validate against a cohort with MI type adjudicated to the Fourth Universal Definition — including the procedural and sudden-death subtypes, which the published literature barely addresses — and report real discrimination metrics (AUC, sensitivity/specificity) following STARD, and TRIPOD if a multi-marker model is built.
- Prospective marker panel. Develop and prospectively test a panel (a rupture-axis marker plus one or more non-Type-I confounder markers), since the atlas shows no single analyte cleanly separates Type I from the non-Type-I subtypes.
- Expert curation & a living catalog. Add a cardiologist curation layer for the Tier-1 markers and maintain the catalog as a versioned, periodically re-harvested resource.
Source code
This project — the CoronaryAtlas app, the de novo catalog, scoring and methodology — is open source at github.com/singamnv/t1-mi-pathway-atlas.
Summary figures
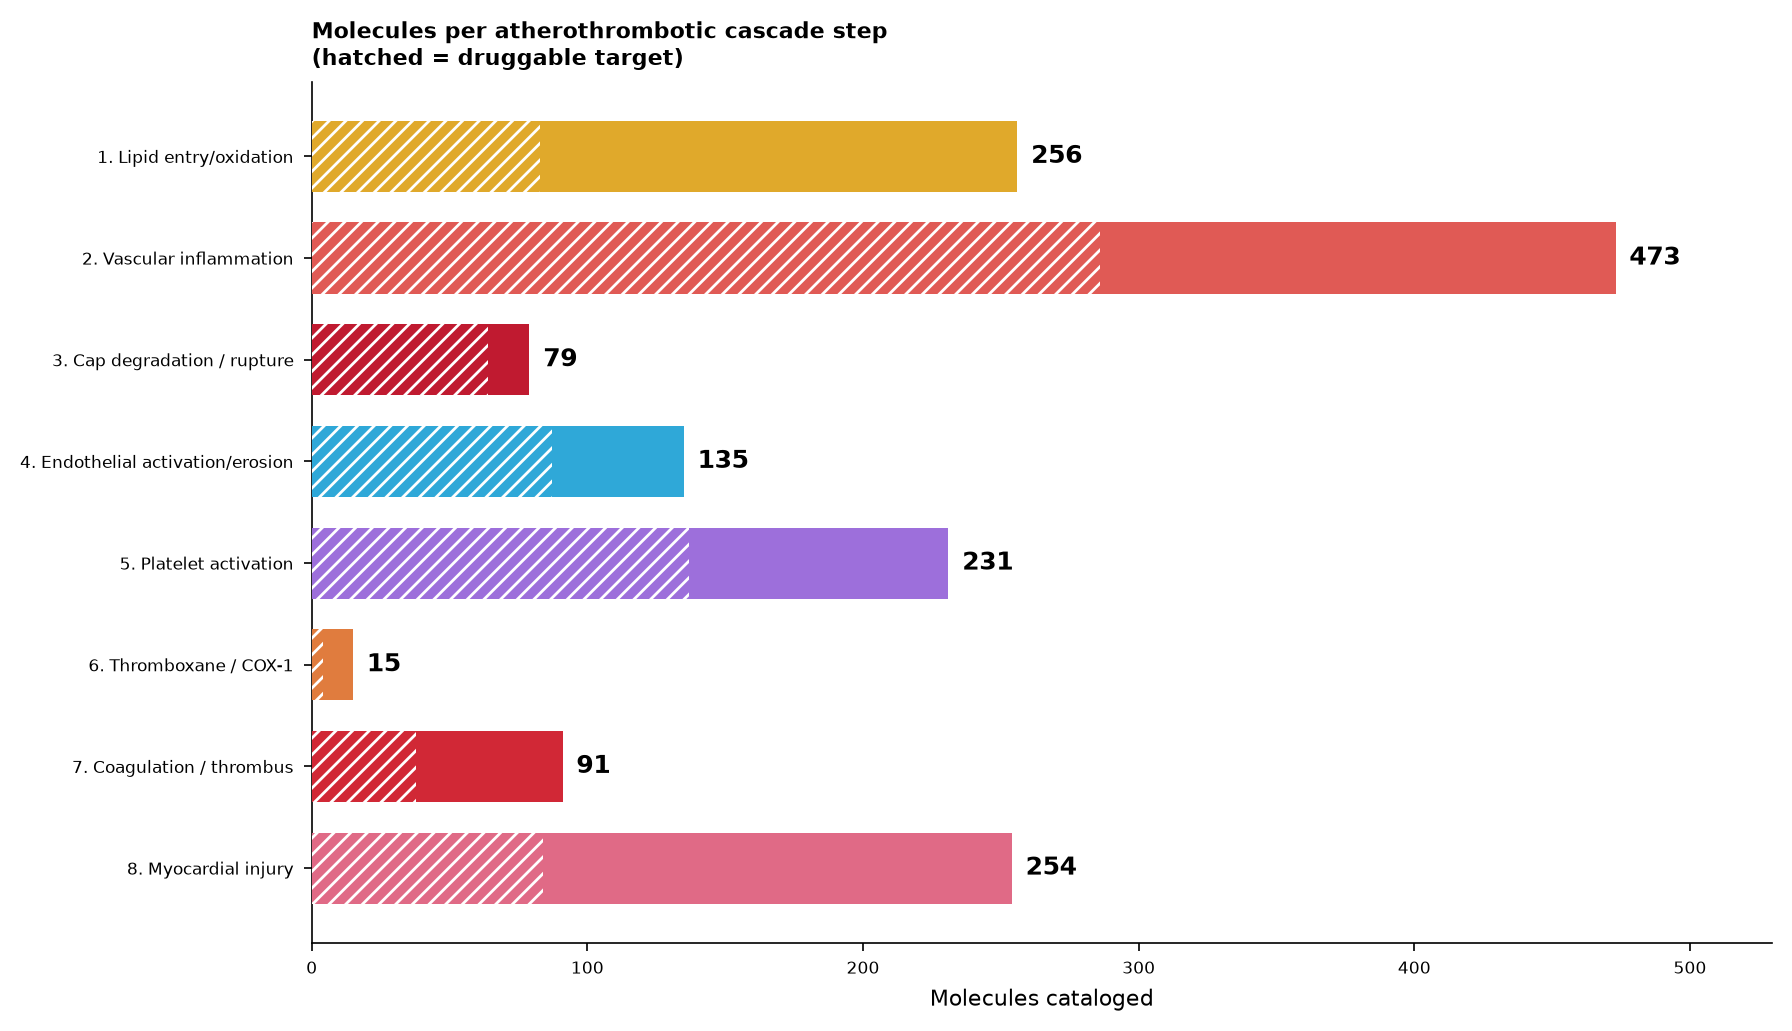
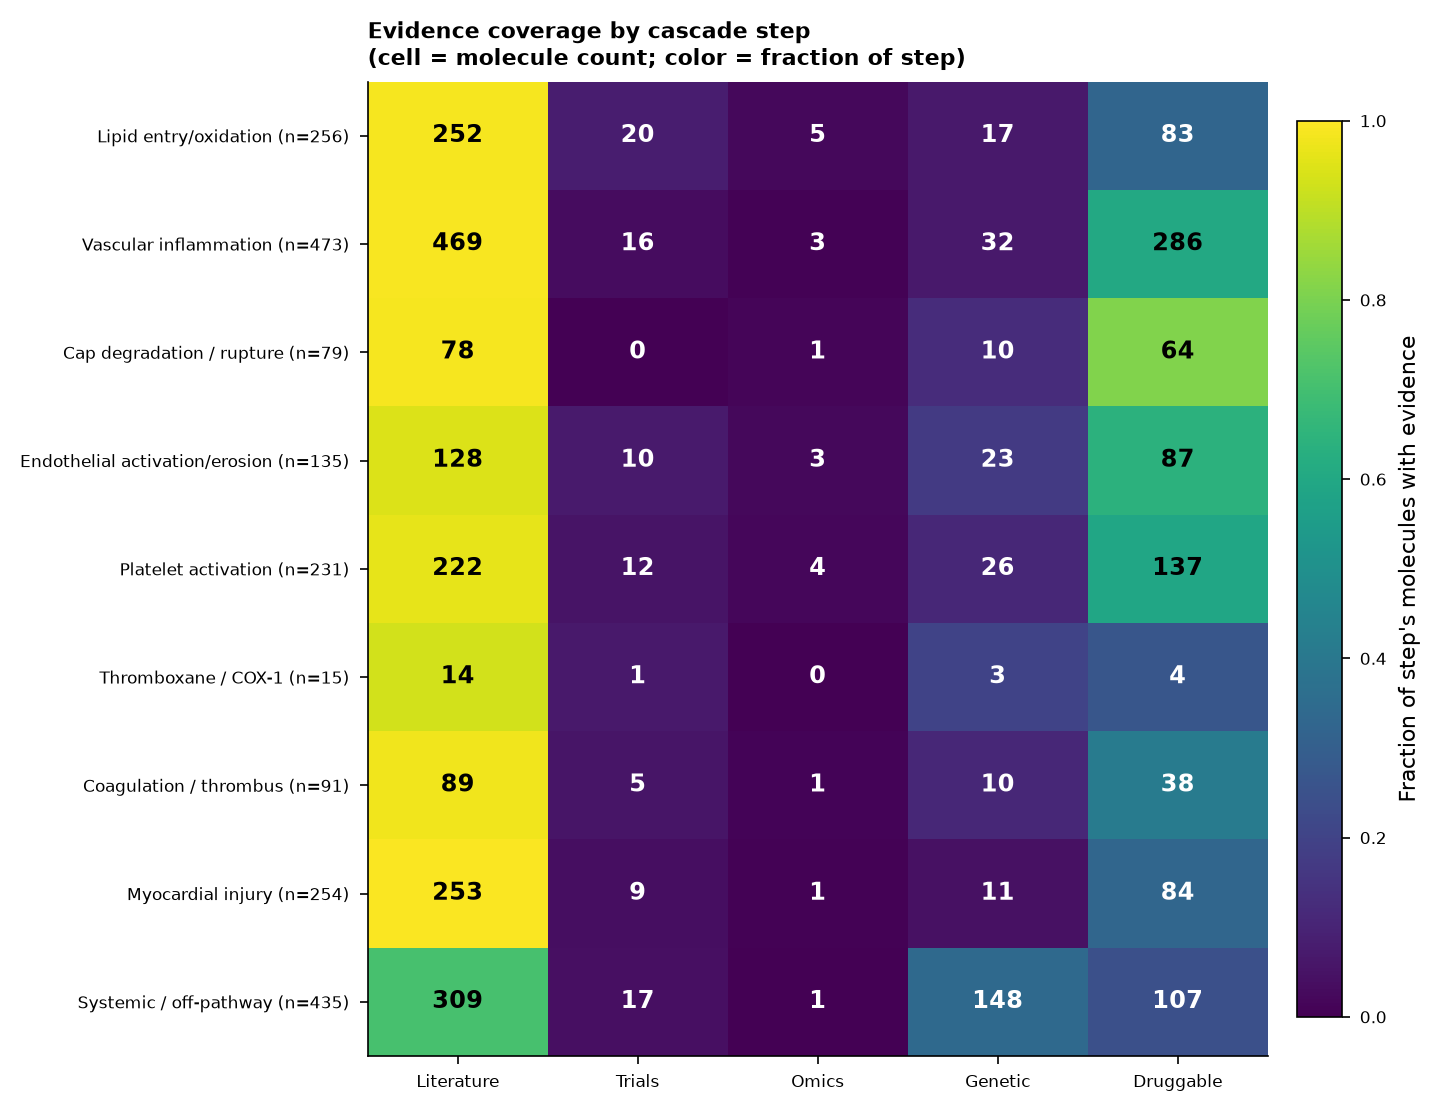
Static, publication-style summaries of the catalog. Interactive versions are on the dashboard.