
External validation in a cardiovascular ICU snapshot
The atlas is built from literature-mined, molecule-level evidence. This page tests one of its central predictions — that a demand / hypoperfusion axis separates Type 2 (demand-related) MI from Type 1 (atherothrombotic) MI — against real patients in an independent, de-identified single-center medical cardiovascular ICU snapshot spanning 7 years. It is an out-of-sample reality check on the feature prior, not a deployable classifier.
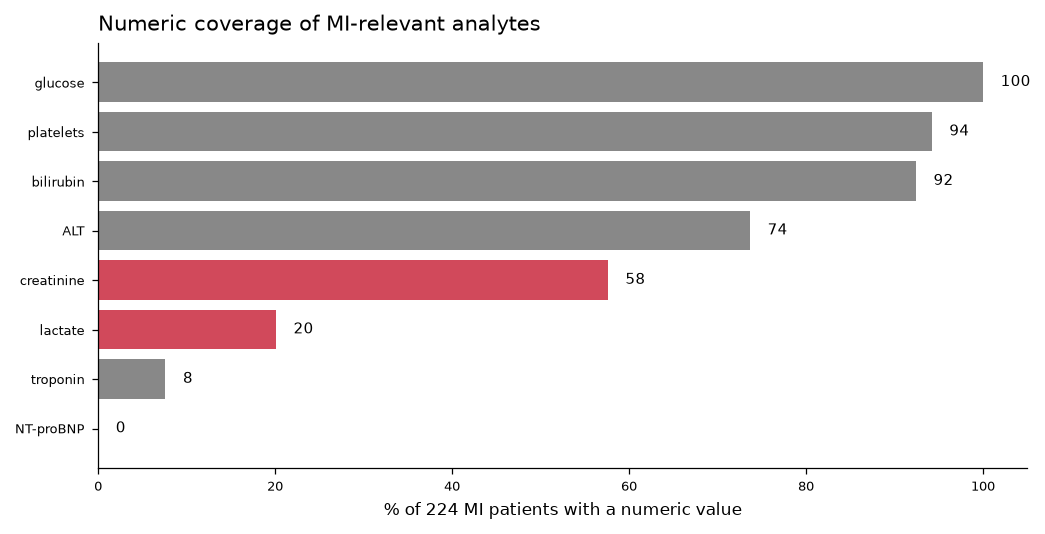
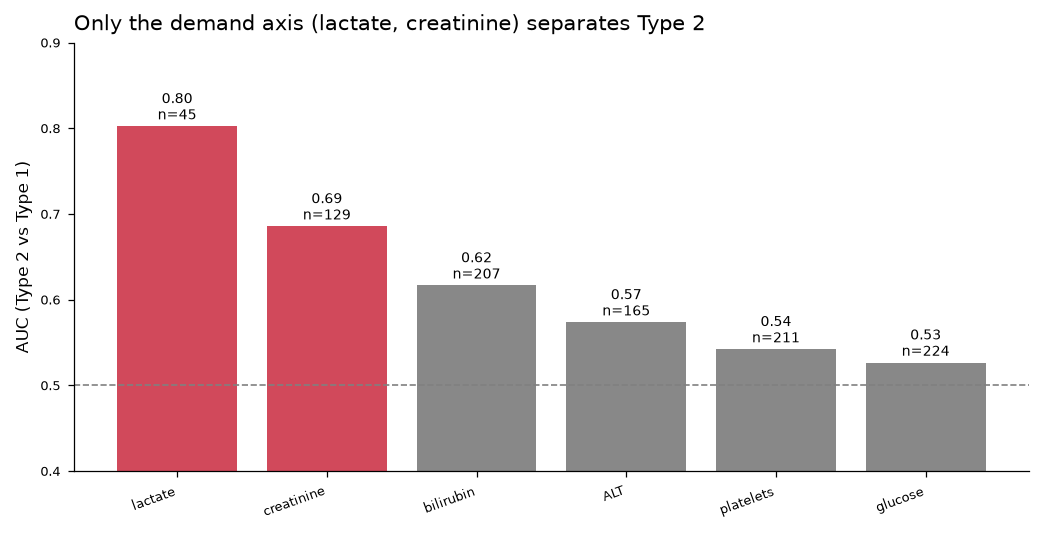
Type 2 MI carries a multiorgan demand-stress fingerprint — higher lactate (AUC 0.80) and creatinine (AUC 0.69) — consistent with supply–demand mismatch from sepsis, hypoxia, or shock. This echoes the atlas's two-axis design. It does not mean Type 1 is separable by plaque-rupture markers here: troponin and CK-MB — the atlas's top two markers — are the exact analytes this ICU snapshot barely captures (troponin, 8%) or never measures (CK-MB).
1 · How MI is coded
MI coded via Primary/Secondary presenting cardiac problem. 'Acute coronary syndrome' is the Type-1/plaque-rupture umbrella (not sub-split into STEMI/NSTEMI, not adjudicated); 'Type 2 (Demand-related) MI' is an explicit separate category.
2 · What is actually measured
This is a critical-care ICU snapshot, not a chest-pain workup: labs are recorded for ICU severity scoring, not to work up the index MI. Cardiac-specific markers are the sparsest. Not collected at all: CK-MB, CRP, procalcitonin, D-dimer, myoglobin, hs-CRP, copeptin.
3 · Which markers separate Type 2 from Type 1
Mann–Whitney tests on every analyte with usable coverage. AUC is on the measured subset (n varies). Rows in red are the two markers that meaningfully discriminate.
| Marker | Type 1 median | Type 2 median | Higher in | p | AUC | n |
|---|---|---|---|---|---|---|
| Lactate | 1.8 mmol/L | 4.2 mmol/L | Type 2 | 0.030 | 0.80 | 45 |
| Creatinine | 1.46 mg/dL | 2.81 mg/dL | Type 2 | 0.003 | 0.69 | 129 |
| Bilirubin | 1.2 mg/dL | 1.2 mg/dL | Type 1 (weak) | 0.001 | 0.62 | 207 |
| ALT | 200 U/L | 200 U/L | Type 1 | 0.002 | 0.57 | 165 |
| Platelets | 150 K/uL | 150 K/uL | — | 0.096 | 0.54 | 211 |
| Glucose | 156 mg/dL | 160 mg/dL | — | 0.538 | 0.53 | 224 |
| Age | 65 yrs | 65.5 yrs | — | 0.550 | 0.53 | 224 |
4 · Relation to the atlas catalog
Registry analytes map onto atlas catalog entries: troponin (cTnI/T), natriuretic peptides (BNP/NT-proBNP), LDH, creatinine, bilirubin. The atlas's #1/#2 markers (troponin, CK-MB) are exactly the ones this registry barely captures (troponin, 8%) or omits (CK-MB).
5 · What this can and cannot support
In this cohort Type 2 MI is separated by the demand/hypoperfusion axis — higher lactate and creatinine — consistent with supply-demand mismatch. Troponin is numeric in only 17/224 patients, so it cannot anchor a panel here. The registry validates the demand-axis feature prior but cannot serve as a training set for a deployable Type-1-vs-Type-2 classifier; that needs an ED chest-pain / rule-out cohort with universal serial hs-troponin and adjudicated labels.
Provenance & limits. Source dataset de-identified; site and dataset name withheld. “ACS” is an initial clinical impression, not adjudicated Type 1. The lactate/creatinine signal is partly confounded with the shock / mechanical-support subgroup, so it may track illness severity as well as Type 2 biology. These results support hypothesis prioritization, not a validated clinical instrument. See the Methods page for atlas provenance.